Usually, climate means the statistical average weather over a 30-year period. Instead, climate variability refers to dispersion around those means, generally at local scales and for shorter periods.

The latest IPCC Working I report summarizes some evidence about increasing climate variability. The IPCC report particularly focus on the increase in the frequency and strength of extreme events.
IPCC also released a special report about extreme events in 2012. The report shows that although there is statistical confidence that heat waves and extreme hot days increased, there is still no evidence that general climate variability has increased.
However, it does not mean there is no increase in global climate variability. It just mean that the data is not enough to certify it statistically.
According to insurance companies, climate variability and climate risks are increasing. Therefore, risk management should be up to date.
IPCC suggests some measures to increase climate resilience, useful in any case. Additionally, they recommend considering available seasonal forecasts, to be aware about extreme event probability in a lead time.
Characterizing Extreme Events.
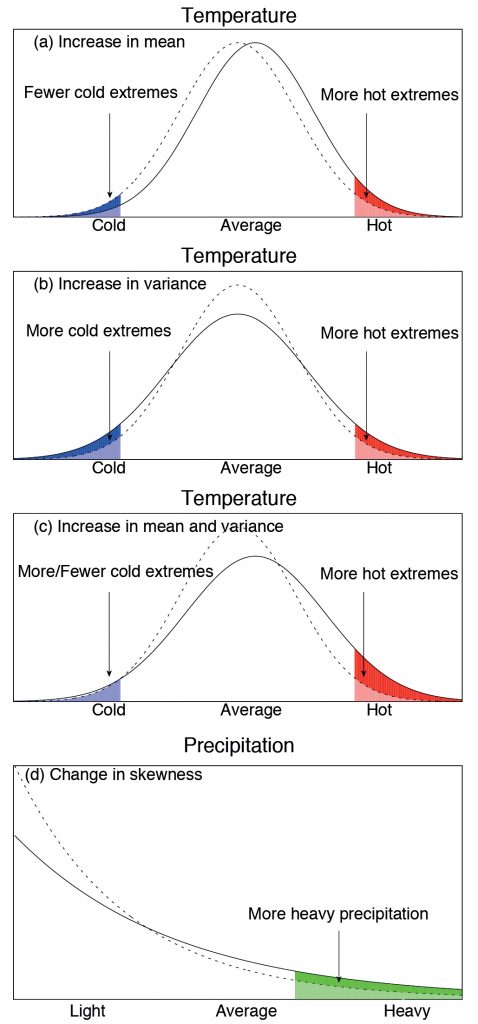
Meteorological variables follow approximately a known frequency distribution. For instance, temperatures follow a normal distribution characterized by mean and variance.
There are several criteria to consider or classify an extreme event. The CLIVAR Program of the World Meteorological Organization recently unified all these criteria in the “Extreme Event Indexes” (ETCCDMI). As many as 27 indexes have been developed, creating calculation algorithms. For instance, to consider a “dry” extreme spell, the index should be the number of consecutive days where rainfall is less than 1 mm.

Climate Change may alter frequency distribution of meteorological variables, shifting means and variances.
An “extreme” or “less probable” temperature (i.e. below percentile 10 or above percentile 90), might be more probable in the future if the general temperature mean significantly increases, as suggested by the GCM simulations.
At the same time, if the distribution variance grows, the probability of what used to be an extreme event becomes higher, making it a “normal” value.
Likewise, changes in the asymmetry coefficient in the rainfall distribution will yield similar consequences to higher variances in the temperatures distribution.
The reported evidence indicates that both mean and variances might be significantly higher in the near future than those derived from historical records.
It means we should expect new frequency distributions. The historical records of meteorological variables may be less reliable. The seasonal forecasts, however, can be a useful tool, since they are based on actual data.

Climate risk management should be updated in vulnerable regions or economical sectors. What is now rare and improbable “extreme events” can become “normal” weather in years to come.

